# Profiling
{% hint style="info" %}
### Task
Given the source code of a program, possibly written by someone else, perform its optimization!
{% endhint %}
## Where to start?
* Analyze the source code and detect inefficient “C” code.
* Re-write some sections in assembly.
* Use more efficient algorithms.
How to determine which sections to optimize?
* A typical application consists of many functions spread over different source files.
* **Manual inspection** of the entire application code to determine which sections to optimize is in many cases **unpractical**!
{% hint style="info" %}
### Amdahl’s law
The performance gain that may be obtained when optimizing a section of code is limited to the fraction of the total time that is spent on that particular section.
{% endhint %}
But how to determine the parts of code that consume the more significant share of CPU?
## Profiling
> Collection of statistical data carried out on the execution of an application
Fundamental to determine the relative weight of each function.
Approaches:
* **Call graph profiling**: function invocation is instrumented.
* Intrusive requires access to the source code, computationally heavy (overhead can reach 20%).
* **Flat profiling**: the application status is sampled at regular time intervals.
* Accurate as long as the functions execution time is much bigger than the sampling period.
### Example
{% hint style="info" %}
### “80/20 Law”
In a “typical” application about 80% of the time is spent in about 20% of the code.
{% endhint %}
### Tools
#### GNU Gprof
Profiling requires several steps.
* Compilation and “linking” of the application with debug and profiling active.
* gcc **-pg** -o sample sample.c
* Run the program to generate statistical data (profiling data).
* ./sample
* Run the gprof program to analyze the data.
* gprof ./sample \[> text.file]
{% hint style="info" %}
#### “-pg”
Generate extra code to write profile information suitable for the analysis program gprof.
{% endhint %}
#### GNU Gcov
Coverage test, complementary to gprof.
Indicates the number of times each line is executed.
* Must compile and link with “-fprofile-arcs -ftest-coverage” to generate additional information needed by gcov.
* gcc **-pg -fprofile-arcs -ftest-coverage** -o sample sample.c -lm
* Run the program to generate statistical data and then run gcov.
* ./sample
* gcov sample.c
* File “sample.c.cov” contains the execution data.
Analyzing the code, an optimization was identified ...
Results with gprof.
Execution time reduced by a factor of 106!!!!
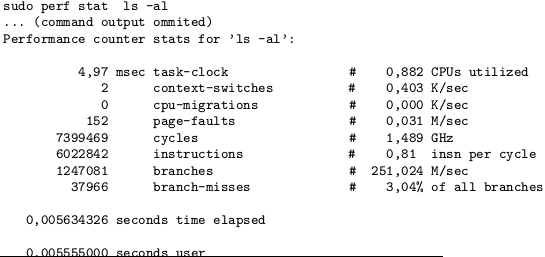
There are many other profiling tools. E.g. “perf”:
* Performance counters for Linux (“perf” or “perf events”): Linux tool that shows performance measurements in the command line interface.
* Can be used for finding bottlenecks, analysing applications’ execution time, wait latency, CPU cycles, etc.
* Events of interest can be selected by the user (“perf list” allows to see the supported events).